These theater industry statistics show where live theater stands in 2026, with the strongest current benchmarks coming from Broadway, the West End, U.S. performing-arts economic data, and theater-employment projections.
theater industry statistics
Theater Industry Statistics (Top Highlights)
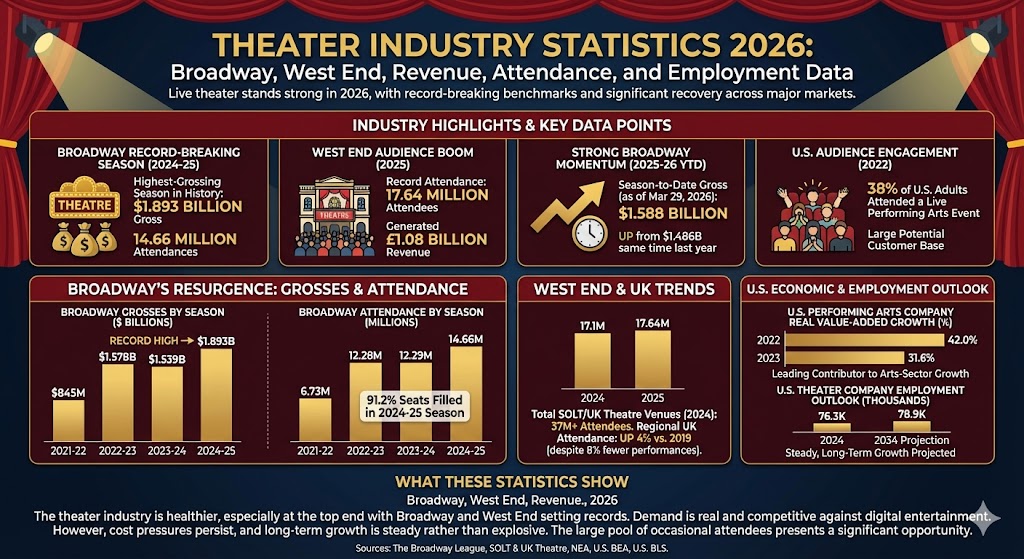
Broadway’s 2024-25 season grossed $1.893 billion on 14.66 million attendances, making it the highest-grossing season in Broadway history.
Broadway attendance rebounded from 6.73 million in 2021-22 to 14.66 million in 2024-25.
Broadway audiences filled 91.2% of available seats during the 2024-25 season.
As of March 29, 2026, Broadway’s 2025-26 season-to-date gross had reached $1.588 billion, up from $1.486 billion at the same point a year earlier.
The West End drew a record 17.64 million attendees in 2025 and generated £1.08 billion in revenue.
In 2024, SOLT and UK Theatre member venues welcomed more than 37 million audience members, with the West End alone reaching 17.1 million attendees.
Regional UK theater attendance rose 4% versus 2019 even though total performances fell 8%, pointing to a leaner operating model.
In 2022, 38% of U.S. adults attended a live performing arts event in person.
BEA said performing arts companies were one of the leading contributors to arts-sector growth, with real value added rising 42.0% in 2022 and 31.6% in 2023.
BLS projects U.S. theater companies and dinner theaters employment will rise from 76.3 thousand in 2024 to 78.9 thousand in 2034.
Broadway revenue has moved sharply above the disrupted 2021-22 season and has now surpassed the previous pre-pandemic high, showing that premium live theater demand has returned at scale.
Attendance recovery has been nearly as important as revenue recovery. Broadway is no longer just relying on higher ticket prices; it is also drawing back a much larger volume of theatergoers.
Broadway Season-to-Date Gross Comparison
Label
Bar
Value
2024-25 season-to-date
$1.486B
2025-26 season-to-date
$1.588B
Max = $1.588B. Widths: 2024-25 season-to-date 93.59%, 2025-26 season-to-date 100.00%
Broadway’s current season is still running ahead of last year on a season-to-date basis, which suggests the market remains healthy even after the record 2024-25 finish.
West End Attendance Trend
Label
Bar
Value
2024
17.1M
2025
17.64M
Max = 17.64M. Widths: 2024 96.94%, 2025 100.00%
The West End is operating at record scale. That matters because it shows the recovery is not limited to New York; large commercial theater districts in other major markets are also drawing massive audiences.
U.S. Performing Arts Company Real Value-Added Growth
Label
Bar
Value
2022
42.0%
2023
31.6%
Max = 42.0%. Widths: 2022 100.00%, 2023 75.24%
Economic growth has cooled from the initial rebound pace, but the sector still posted another strong gain in 2023, showing that performing arts companies continued expanding after the reopening surge.
U.S. Theater Company Employment Outlook
Label
Bar
Value
2024
76.3K
2034
78.9K
Max = 78.9K. Widths: 2024 96.70%, 2034 100.00%
The employment outlook points to slow expansion rather than explosive growth. That fits a mature industry where audience demand is solid, but production economics remain tight.
What These Theater Industry Statistics Show
The theater industry in 2026 looks healthier than it did a few years ago, especially at the top end of the market. Broadway has already set a new gross record, and the West End has also reached record audience levels. That tells us live theater remains highly competitive against digital entertainment when the product is strong and the market is dense enough.
At the same time, the industry is not operating without pressure. UK theater bodies continue to warn about rising production costs, while U.S. labor and economic data suggest steadier long-term growth than a pure boom. In other words, demand is real, but profitability and operating sustainability still matter just as much as ticket sales headlines.
One more useful benchmark is audience behavior. With 38% of U.S. adults reporting attendance at a live performing arts event in 2022, the potential customer base for theater remains large, but it still leaves plenty of room for operators, producers, and marketers to win back occasional and lapsed attendees.
Sources
The Broadway League, Statistics – Broadway in NYC
The Broadway League, Grosses – Broadway in NYC, week ending March 29, 2026
The Broadway League, Broadway’s 2024-25 Season Wraps with 14.7 Million Attendances and Grosses of $1.89 Billion
Society of London Theatre and UK Theatre, The State of British Theatre in 2025
Society of London Theatre and UK Theatre, Theatre in the UK 2026
National Endowment for the Arts, 50 States of Arts Participation: 2022
U.S. Bureau of Economic Analysis, Arts and Cultural Production Satellite Account, U.S. and States, 2023
U.S. Bureau of Labor Statistics, Employment and Output by Industry, 2024 National Employment Matrix
Immerse yourself in the ultimate audio experience with the 10 best ELAC home theater speaker systems, but which one will transform your space the most?
Immerse yourself in superior sound quality with our top 10 compact surround sound speaker systems—discover which one will transform your audio experience today!