These Broadway statistics highlight the latest official figures on season grosses, attendance, ticket prices, production volume, audience mix, and recent Broadway performance trends in New York City.
Broadway statistics
Broadway statistics (top highlights)
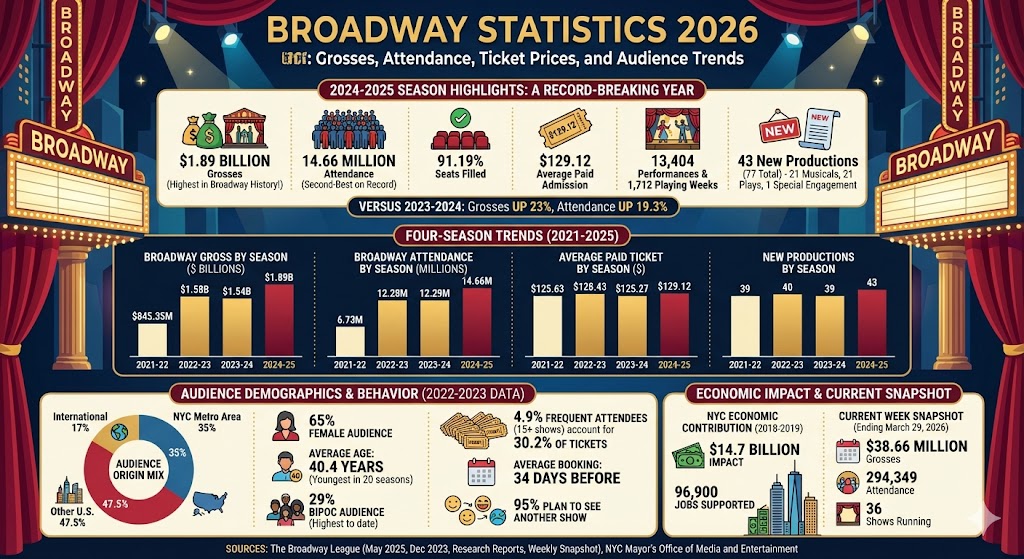
Broadway’s 2024-2025 season generated $1.89 billion in grosses, making it the highest-grossing season in recorded Broadway history.
Attendance reached 14.66 million in 2024-2025, the second-best attended season on record.
Audiences filled 91.19% of available seats in the 2024-2025 season.
The average paid admission rose to $129.12 in 2024-2025.
Broadway logged 1,712 playing weeks and 13,404 performances in 2024-2025.
There were 43 new productions in 2024-2025.
Compared with 2023-2024, the 2024-2025 season was up 23% in gross and 19.3% in attendance.
The 2024-2025 season included 77 productions overall.
Among 2024-2025 openings, Broadway had 21 musicals, 21 plays, and 1 special engagement.
The 2023-2024 season grossed $1.54 billion on 12.29 million admissions.
The 2022-2023 season grossed $1.58 billion on 12.28 million admissions.
The 2021-2022 return season grossed $845.35 million on 6.73 million admissions.
In the latest freely surfaced Broadway League audience report, 35% of 2022-2023 attendances came from the New York City metro area, 47.5% from elsewhere in the U.S., and 17% from other countries.
65% of Broadway audiences identified as female in 2022-2023.
The average Broadway theatregoer was 40.4 years old in 2022-2023, the youngest in the past 20 seasons.
29% of attendees identified as BIPOC in 2022-2023, the highest share to date in the League’s demographic study.
Only 4.9% of the audience attended 15 or more performances in 2022-2023, yet that group accounted for 30.2% of all tickets.
The average reported Broadway ticket purchase was made 34 days before the performance in 2022-2023.
95% of surveyed attendees said they planned to see another Broadway show in the future.
The Broadway League’s latest biennial NYC economic report says Broadway contributed $14.7 billion to New York City’s economy in 2018-2019 and supported 96,900 jobs.
For the week ending March 29, 2026, Broadway grossed $38.66 million, drew 294,349 attendees, and had 36 shows running.
The latest freely surfaced Broadway League demographic release currently available is for the 2022-2023 season, so the audience mix below reflects that study.
Label
Bar
Value
NYC metro area
35.0%
Other U.S.
47.5%
International
17.0%
Max = 47.5%. Widths: NYC metro area 73.68%, Other U.S. 100.00%, International 35.79%
What these Broadway statistics show
Broadway has recovered sharply from its abbreviated return season and is now operating at record gross levels. The biggest headline is that 2024-2025 set a new all-time gross record, while attendance climbed back near pre-pandemic highs.
At the same time, the data shows that Broadway’s rebound is not only about more tickets sold. Average paid admission has remained high, which means revenue recovery has outpaced ticket-count recovery. That is one reason Broadway could post a record gross season without surpassing the all-time attendance peak from 2018-2019.
The audience data also shows that Broadway remains heavily tourism-driven, with most attendances coming from outside the New York City metro area. Domestic travelers remain the largest audience block, while international visitors continue to be an important share of Broadway demand.
Broadway also remains a major economic engine. The Broadway League’s latest biennial New York City impact report on its site attributes $14.7 billion in economic contribution and 96,900 supported jobs to the 2018-2019 season, underlining how strongly theatre spending extends beyond the box office.
For a current operating snapshot, The Broadway League reported that the week ending March 29, 2026 produced $38.66 million in grosses, 294,349 in attendance, and 36 running shows, showing that Broadway entered spring 2026 with solid commercial momentum.
Sources
The Broadway League, Broadway’s 2024-2025 Season Wraps with 14.7 Million Attendances and Grosses Of $1.89 Billion, May 2025.
The Broadway League, Broadway Season Statistics: 2014-2015 through 2024-2025.
The Broadway League, Statistics – Broadway in NYC.
The Broadway League, The Demographics of the Broadway Audience report press release for the 2022-2023 season, December 2023.
The Broadway League, Research Reports page, including Broadway’s Economic Contribution to New York City 2018-2019.
The Broadway League homepage weekly snapshot, week ending March 29, 2026.
NYC Mayor’s Office of Media and Entertainment, New York City Small Theater Industry Cultural and Economic Impact Study, for Broadway / Off-Broadway seating definitions.
Make every movie night unforgettable with the top 10 projectors for ultrawide screens in 2025—discover which one will redefine your viewing experience.
Uncover the ultimate cassette players that revive your favorite mixtapes in style—discover which models will transform your nostalgic listening experience today!