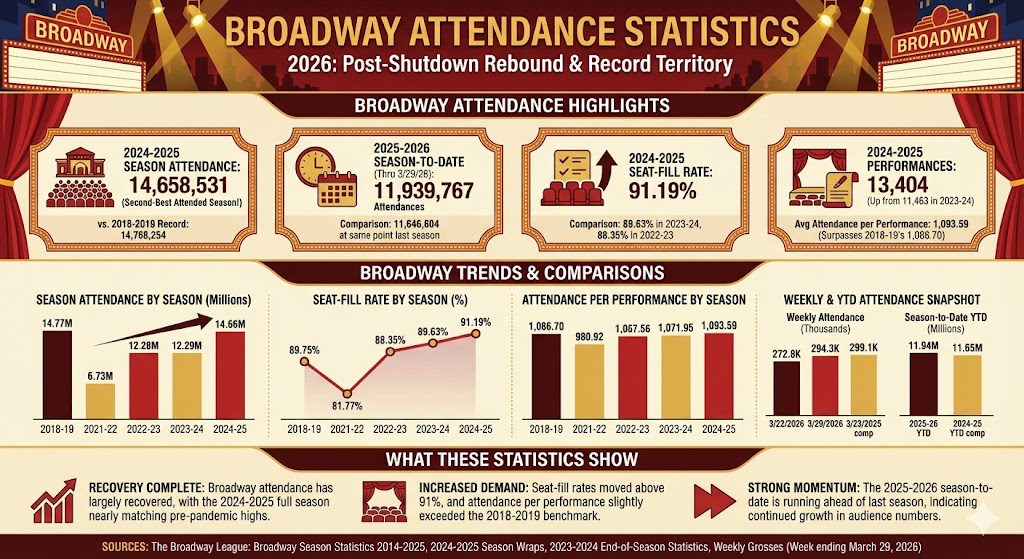
These Broadway attendance statistics show how audience demand has rebounded from the post-shutdown low and moved back toward record territory. The latest full Broadway season reached 14,658,531 attendances, while the 2025-2026 season had already logged 11,939,767 attendances through the week ending March 29, 2026.
Broadway attendance statistics
In The Broadway League’s reporting, attendance includes paid and complimentary tickets. Most Broadway seasons run 52 weeks, but a 53rd week is added periodically to realign the reporting calendar.
Broadway Attendance Statistics (Top Highlights)
Broadway recorded 14,658,531 attendances in the 2024-2025 season, making it the second-best attended season in the League’s current summary table.
The highest full-season attendance in the 2014-15 through 2024-25 summary remains 14,768,254 in 2018-2019.
The 2025-2026 Broadway season-to-date reached 11,939,767 attendances through March 29, 2026, versus 11,646,604 at the comparable point last season.
The week ending March 29, 2026 drew 294,349 attendances, up from 272,806 the prior week.
Broadway filled 91.19% of seats in 2024-2025, up from 89.63% in 2023-2024 and 88.35% in 2022-2023.
The shortened 2021-2022 return season recorded 6,729,143 attendances across 6,860 performances.
Broadway logged 13,404 performances in 2024-2025, up from 11,463 in 2023-2024.
Average attendance per performance rose to 1,093.59 in 2024-2025, slightly above 1,086.70 in 2018-2019.
Looking at attendance per performance helps normalize for how many performances Broadway staged in each season. These figures are calculated from total attendance divided by total performances.
The main story is that Broadway attendance has largely recovered. The latest full season nearly matched the pre-pandemic high, seat-fill rates moved above 91%, and attendance per performance reached a level slightly above the 2018-2019 benchmark.
The 2025-2026 season also appears to be running ahead of last season on a season-to-date basis, although weekly attendance can still move around depending on the production mix, holiday timing, and the number of shows playing in a given week.
Sources
The Broadway League, Broadway Season Statistics: 2014-2015 through 2024-2025
The Broadway League, Broadway’s 2024-2025 Season Wraps with 14.7 Million Attendances and Grosses of $1.89 Billion
The Broadway League, Broadway’s 2023-2024 End-of-Season Statistics Reveal 12.3 Million Attendances and Grosses of $1.54 Billion
The Broadway League, Grosses – Broadway in NYC, weekly totals for week ending March 29, 2026
Perfect your sound quality with the 10 best turntable isolation feet that promise to control vibrations—discover which options will elevate your audio experience.
Prepare to discover the 10 best 8K projectors of 2025 that promise to revolutionize your home theater experience, but which one will claim the top spot?